Guide 1
What Biodiversity Actually Means
Biodiversity is usually explained as "the variety of life", which is true and not very useful. It operates at three levels, and confusing them is the source of most bad arguments about it.
**Genetic diversity** is variation within a species. It is what allows a population to adapt to disease, drought or a changing climate. A population reduced to a few dozen individuals may look recovered once numbers climb again, but the genetic variation lost in the bottleneck does not come back.
**Species diversity** is the number and relative abundance of different species in a place. This is what most people picture, and it is what extinction figures measure.
**Ecosystem diversity** is the range of habitat types and the interactions within them — who eats whom, who pollinates what, who disperses which seeds.
The last one matters most for the argument that follows. Ecosystems are not lists of species; they are sets of relationships. You can lose a great deal of function long before you lose the last individual of anything.
Guide 2
How Bad Is It? What the Evidence Says
The most authoritative synthesis is the IPBES Global Assessment, which concluded that around one million animal and plant species are now threatened with extinction, many within decades — more than at any previous point in human history.
That figure is often misreported, so it is worth stating precisely. It does not mean a million species have gone extinct. It means roughly a million are assessed as facing extinction risk. The estimate was derived by extrapolating from the proportion of well-studied groups that are threatened to the much larger number of described species, which is why it is expressed as an order of magnitude rather than a precise count.
It is also worth noting what the number does not capture. Population declines within surviving species are a real loss of biodiversity — a species reduced from millions to thousands is still present on the list, and functionally far less significant in its ecosystem. Extinction is the endpoint, not the measure.
Guide 3
The Five Drivers, in Order
IPBES ranks the drivers by their global impact, and the order matters because it tells you where effort pays.
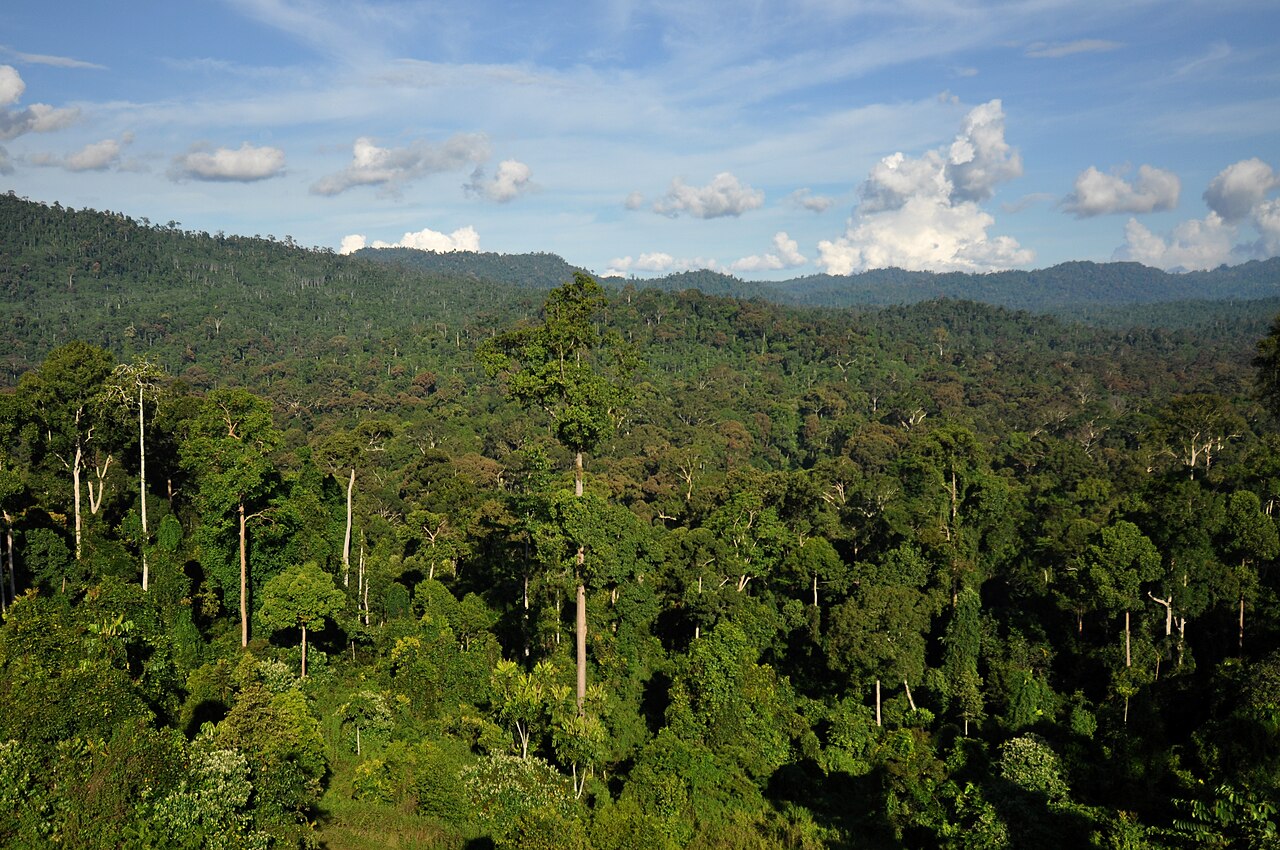
**1. Habitat change.** Land-use change is the largest driver on land, and agriculture is the largest component of it. More than a third of the world's land surface has been transformed for food production, along with roughly 75% of fresh water use. Between 1980 and 2000 alone, 100 million hectares of tropical forest were lost — mainly to cattle ranching in Latin America, around 42 million hectares of it, and to plantations in South-East Asia.
**2. Direct exploitation.** Hunting, fishing, logging and the wildlife trade. For marine systems this is the leading driver rather than the second.
**3. Climate change.** Currently ranked third and rising fastest. It compounds the others: a fragmented population has nowhere to move to when its climate envelope shifts.
**4. Pollution.** Nutrient runoff, plastics, pesticides, light and noise.
**5. Invasive species.** Introduced predators, competitors and diseases, with island endemics disproportionately affected.
The practical implication is unpopular but clear. Climate change dominates public discussion of environmental loss, and it is third on this list. Habitat conversion for agriculture is first, by a distance — which is why factory farming explained sits alongside this page rather than separately from it.
Guide 4
Why It Matters Beyond the Species Themselves
The intrinsic argument — that a species is worth keeping for its own sake — is a real one and does not need economic justification. But the instrumental case is what tends to move policy, so it is worth knowing.
**Function is redundant until it isn't.** Ecosystems tolerate species loss for a while because several species often do a similar job. That redundancy is what makes decline look survivable right up until the point where it isn't. Losing the last large-seeded-fruit disperser in a forest changes which trees regenerate.
**Pollination and pest control.** A large share of food crops depend on animal pollination, and the insects doing it are also the insects being lost to habitat conversion and pesticides.
**Disease.** Habitat fragmentation and wildlife trade increase contact between wildlife, livestock and people, which is the pathway most zoonotic spillovers take.
**Loss is not reversible.** Habitat can be restored, sometimes well. Extinction cannot be, and the genetic diversity lost in a bottleneck does not return with the population.
Guide 5
What Actually Helps
Some interventions have strong evidence behind them and some are mostly reassuring.
**Protecting intact habitat beats restoring degraded habitat**, by a wide margin and at a fraction of the cost. Restoration is valuable and it is a second-best.
**Connectivity matters as much as area.** Several small reserves with no corridors between them support far less than the same area connected. Fragmentation is what turns a large population into several small ones that each fail independently.
**Prey and food-plant recovery comes first.** The Iberian lynx recovery worked because rabbit populations were restored before cats were released; releasing predators into landscapes without prey produces dead predators.
**Demand reduction works on exploitation.** Enforcement raises the cost of trafficking; demand reduction lowers the reward. Both are needed and the second is chronically underfunded.
**Be sceptical of tree-planting as a headline.** Planting is not restoration if the species are wrong, the site was not previously forest, or nobody returns in year three. Assisted natural regeneration frequently outperforms it.